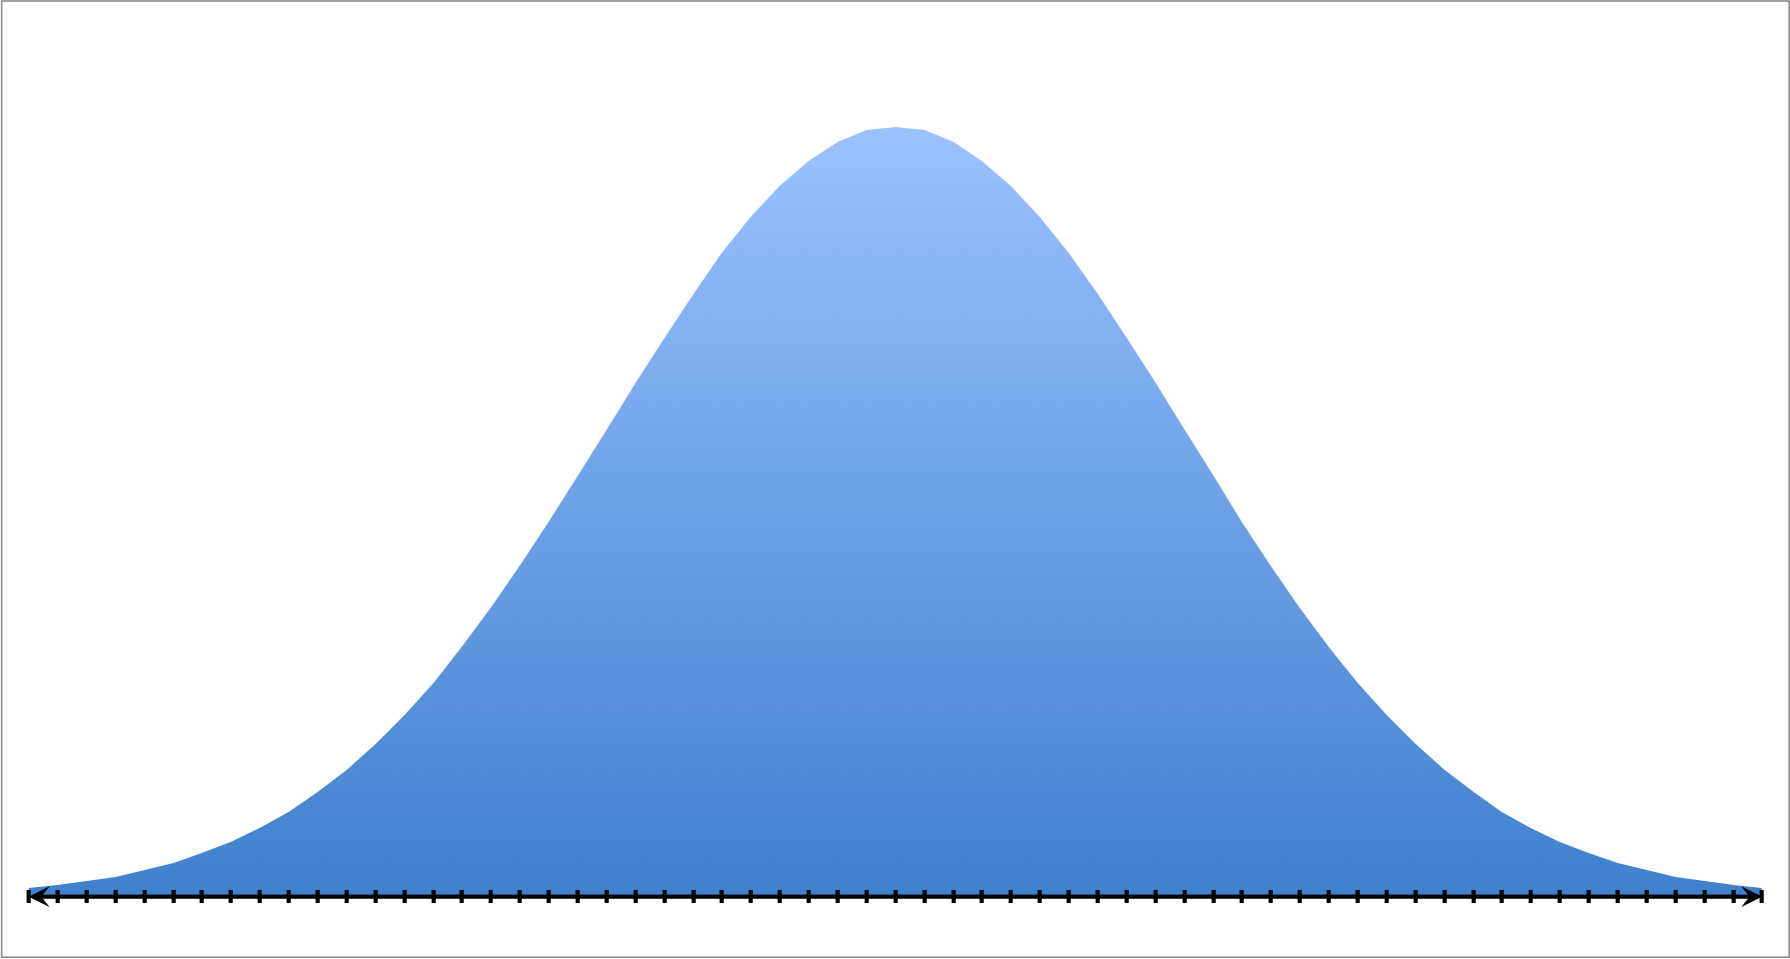
The statistical description is a discipline that is responsible for collecting, storing, sorting, making tables or graphs and calculate basic parameters of the dataset.
Descriptive statistics is, together with statistical inference or inferential statistics, one of the two great branches of statistics. Its own name indicates it, it tries to describe something. But do not describe it in any way, but in a quantitative way. Consider the weight of a box of vegetables, the height of a person, or the amount of money a business earns. We could say many things about these variables. For example, we could indicate that this or that box of tomatoes weigh a lot or weigh less than others. Continuing with another example, we could say that the income of a company varies a lot over time or that a person has an average height.
To dictate the above statements, about much, little, high, low, very variable or little variable we need measurement variables. That is, we need to quantify them, offer a number. With this in mind, we could use grams or kilograms as the unit of measurement to find the weight of as many boxes of tomatoes as we consider. Once we weigh thirty boxes, we will know which ones weigh more, which ones weigh less, how much is the most repeated or if there is a lot of disparity between the weights of the different boxes.
Descriptive statistics was born with this idea, with the purpose of collecting data, storing it, making tables or even graphs that offer us information on a certain subject. Additionally, they offer us measures that summarize the information of a large amount of data.
Types of statistical variables
Within descriptive statistics, we can describe the data qualitatively or quantitatively.
- Qualitative variable: It refers to a quality. Examples: a person's eye color or hair color.
- Quantitative variable: It refers to a quantitative measure. Examples: the height of a person in centimeters or the weight of a person in kilograms.
Basic statistical parameters
In order to summarize the information, various formulas were devised that offered measures of a certain type. Thus, there are those that offer us information about the center, others about the dispersion or variability and others about the position of a value.
- Measures of central tendency: So named because they provide information about the center of the data set. For example, the mean is a measure of trend or central position since the average gives us a centered value of the data set. Where could we say that the midpoint is located? In the center, in the middle approximately. Another example of a measure of central tendency is the median.
- Measures of dispersion: They are also known as measures of variability. For example, the standard deviation is a measure of variability since it tells us whether the values in a data set are very disparate or not. Two more examples of measures of dispersion could be the variance and the statistical range.
- Position measurements: They are not the best known, but they are used frequently. An example of this is found in the percentiles or deciles. When a specific data is in the 90th percentile, it means that 90% of data is below that data. There are other measures of position such as quartiles or some variants such as the first quartile.
Frequency distribution
It is also interesting to see how the frequencies are distributed. For this, there are certain concepts that we must know:
- Absolute frequency: It is the total number of times an observation is repeated. Observations can sometimes be presented at intervals.
- Relative frequency: It is the number in percentage that an observation or a set of them is repeated.
- Accumulated frequency: It can be accumulated relative or accumulated absolute . Indicates the amount accumulated up to a certain observation.
Tables and graphs in descriptive statistics
Although tables and graphs are not unique to descriptive statistics, they do characterize it. In reports, studies and research, the use of graphs is very common. They help us to show the information in a simpler and more limited way.Of course, within the tables and graphs there are an immense amount of types. Here are some examples of frequently used graphs and tables.
- Histogram .
- Bar chart .
- Pie chart .
- Probability tables .
- Two-dimensional tables .
- Box chart .
Descriptive statistics examples
An example of descriptive statistics would be when we want to calculate the average goals per game of a footballer. It is descriptive statistics, since we try to describe a variable (number of goals). In this case, by calculating a metric.Thus, to say that Ronaldo scored 1.05 goals per game during the last 30 games is a proper descriptive statistic phrase.
We could also say, for example, that 30% of my classmates have blue eyes, 60% brown and the remaining 10% black. It would be a qualitative variable (eye color), but we are describing the frequency with which it appears.
Luke is passionate about fostering student involvement and connection. He studied psychology for his major and likes learning about the past. Luke aims to specialize in artificial intelligence and cybersecurity. .
Leave a reply
Your email address will not be published. Required fields are marked *Recent post

Descriptive statistics: What is it, definition and concept
