The range is a numerical value that indicates the difference between the maximum and minimum value of a population or statistical sample.
The range is usually used to obtain the total dispersion. That is, if we have a sample with two observations: $10 and $100, the range will be $90.
Especially in finance, the range is very useful to see how big a variation or change could become. It is also worth mentioning that, on many occasions, the range is not a fixed measure. For example, let's imagine that the growth of the gross domestic product (GDP) of a country has been between 3 and 5% during the last 20 years. The range for this data will be 2% but this does not mean that it will always be that. So if in year 21, the growth is -1%, the range of the last 21 years, will go from 2% to 6%.
It is also known as a statistical tour.
Range formula
To calculate the range of a sample or statistical population we will use the following formula:
R = Max x - Min x
Where
- R is the range.
- Max is the maximum value of the sample or population.
- Min is the minimum value of the sample or statistical population.
- x is the variable on which this measure is to be calculated.
Example of rank in statistics
Suppose we have a company that produces microphones and then sells them to major computer brands. This company entrusts an economist to carry out a study on the evolution of sales (last 4 years) to, later, offer advice that improves business results. Among many other metrics, the microchip production range is required to be calculated. Below is the following data table:
| Month 1 | 44,347 |
| Month 2 | 12,445 |
| Month 3 | 26,880 |
| Month 4 | 23,366 |
| Month 5 | 42,464 |
| Month 6 | 15,480 |
| Month 7 | 21,562 |
| Month 8 | 11,625 |
| Month 9 | 39,496 |
| Month 10 | 39,402 |
| Month 11 | 47,699 |
| Month 12 | 44,315 |
| Month 13 | 29,581 |
| Month 14 | 44,320 |
| Month 15 | 35,264 |
| Month 16 | 10,124 |
| Month 17 | 43,520 |
| Month 18 | 26,360 |
| Month 19 | 19,534 |
| Month 20 | 30,755 |
| Month 21 | 37,327 |
| Month 22 | 15,832 |
| Month 23 | 33,919 |
| Month 24 | 29,498 |
| Month 25 | 46,136 |
| Month 26 | 18,007 |
| Month 27 | 36,339 |
| Month 28 | 27,696 |
| Month 29 | 47,413 |
| Month 30 | 47,636 |
| Month 31 | 20,978 |
| Month 32 | 49,079 |
| Month 33 | 40,668 |
| Month 34 | 45,932 |
| Month 35 | 40,454 |
| Month 36 | 46,132 |
| Month 37 | 35,054 |
| Month 38 | 11,906 |
| Month 39 | 22,532 |
| Month 40 | 43,045 |
| Month 41 | 45,074 |
| Month 42 | 16,505 |
| Month 43 | 27,336 |
| Month 44 | 37,831 |
| Month 45 | 29,757 |
| Month 46 | 37,765 |
| Month 47 | 22,237 |
| Month 48 | 38,601 |
| MAXIMUM | 49,079 |
| MINIMUM | 10,124 |
| RANK | 38,955 |
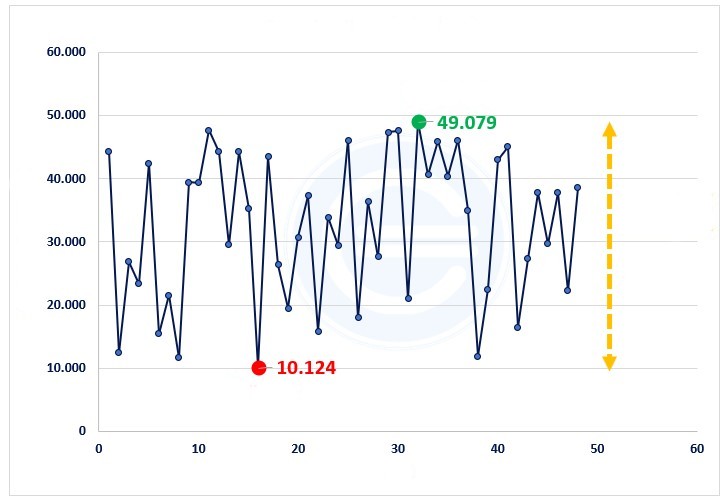
How is this interpreted? This means that during the last 4 years the maximum variation that has occurred has been 38,955 microphones produced. Graphically we can see it as follows:

The green point is the maximum, the red point the minimum, and the yellow dotted line to the right is the difference. That is, the range.
The above content published at Collaborative Research Group is for informational purposes only and has been developed by referring reliable sources and recommendations from experts. We do not have any contact with official entities nor do we intend to replace the information that they emit.
Luke is passionate about fostering student involvement and connection. He studied psychology for his major and likes learning about the past. Luke aims to specialize in artificial intelligence and cybersecurity. .
Leave a reply
Your email address will not be published. Required fields are marked *Recent post

Descriptive statistics: What is it, definition and concept
